_IV.jpg)
Determining Release Locations for Rehabilitated Birds
I am a volunteer for International Bird Rescue, and one of the amazing things I get to do as a volunteer (besides cleaning enclosures and cutting up fish) is release rehabilitated birds back into the wild. I am also interested in GIS, and for a geospatial analysis project I decided to look at the question of where to release birds that have been rehabilitated at the local IBR wildlife center.
I’m not a bird expert, so some of the assumptions that I made while developing this analysis will be wrong. It is an experiment, and my hope is that it can at least serve as as starting point for considering how GIS can be applied to this question and what changes are needed for it to be useful.
This material was created for my capstone project for the Coursera Specialization in GIS by UC Davis. The results do not represent the policies or practices of International Bird Rescue. I’m just a volunteer. All assumptions, interpretations, and errors are my own.
Introduction
Wildlife rehabilitation is the practice of treating and caring for sick, injured, or orphaned wild animals. The wildlife rehabilitator’s goal is to return the animal to its life in the wild once it is healthy and able to take care of itself. To give animals their best chance to thrive, the rehabilitator tries to release them in the right habitat where they will have access to the right food and shelter.
Release sites are chosen by the wildlife rehabilitator based on their experience and the advice of wildlife experts. This project explores using a data-driven approach to finding release locations by performing a suitability analysis using data about species abundance, protected wildlife area boundaries, and proximity to the rehabilitation center.
International Bird Rescue (IBR) specializes in rehabilitating aquatic birds, primarily at its wildlife centers in Los Angeles and the San Francisco Bay Area. IBR routinely handles a large variety of bird species. As a case study, I chose to focus on the Western Grebe, IBR’s Bird of the Year for 2020 and one of the more commonly treated species. There is nothing specific to Western Grebes in the analysis other than the abundance data. The same method can be applied to any other bird species for which data is available.
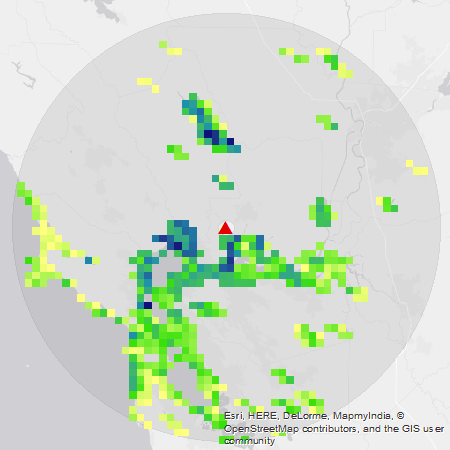
Here is an interactive map that shows the final result. The colors of the squares represent the estimated relative value of that area for releasing Western Grebes, ranging from yellow (zero value) through green to dark blue (highest value), using the year-round average abundance. The red marker shows the location of the IBR wildlife center. The shaded grey circle shows the study area, a radius of 85km around the wildlife center.
Abundance
The most important factor when choosing where to release a bird is habitat, which simply means where that kind of bird likes to live. An interesting source of data about habitat is available from eBird Status and Trends.1 They provide freely available abundance and range data for hundreds of birds species based on observations made by the global birding community.
Abundance is a relative measure of how many birds of a given species are estimated to be in a certain area during a certain part of the year.2 I use abundance as a simple proxy for habitat. We want to know where a bird is likely to thrive in the wild, and the more members of its species that can be found in an area, the better that area is likely to be.
eBird has abundance data by week and also the year-round average. For some species, like Western Grebe, they also have seasonally averaged abundance, which is based on the breeding patterns of that species. The seasons are breeding, non-breeding, pre-breeding migration, and post-breeding migration. Most of the examples presented here show the Western Grebe’s breeding season, May 31 - July 20.
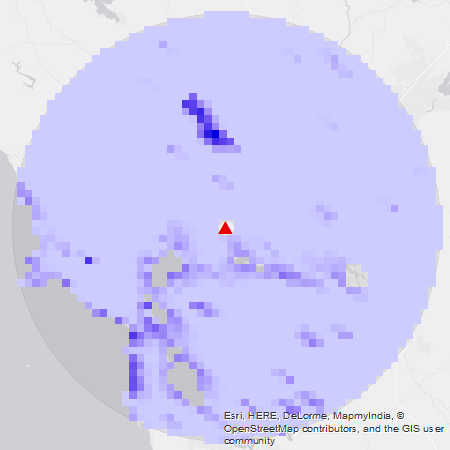
Abundance of Western Grebes in the study area during its breeding season. Darker blue represents greater abundance. The lightest blue represents zero abundance, meaning Western Grebes are not seen in that area.
Other Factors
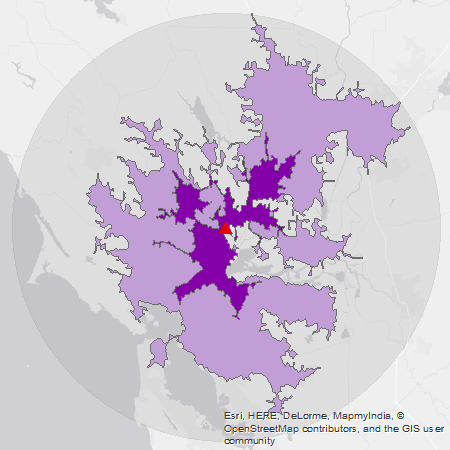
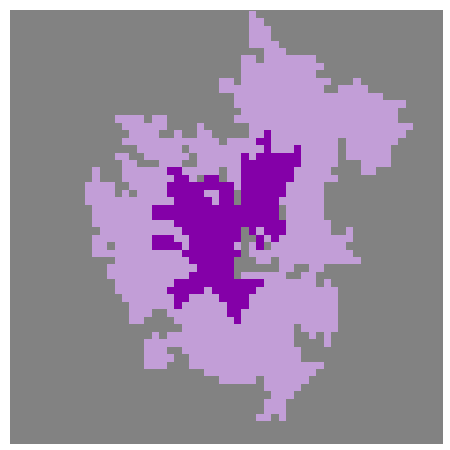
Travelling in a crate is stressful for a wild animal, so we would like to limit it to a reasonable amount of time. I factored this into the analysis by using drive-time areas that represent the area you could expect to reach by car within a certain amount of time starting from the rehab center.3 We don’t need a lot of precision here, so I used just two: a 30-minute area and a 60-minute area.
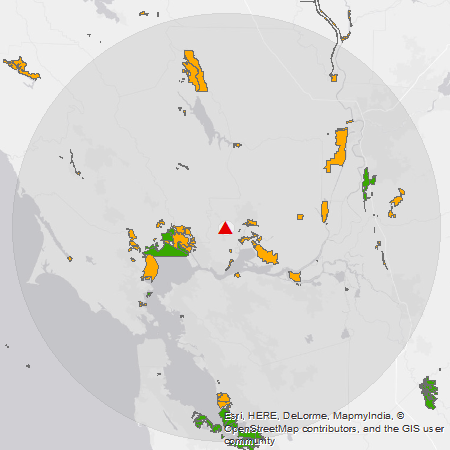
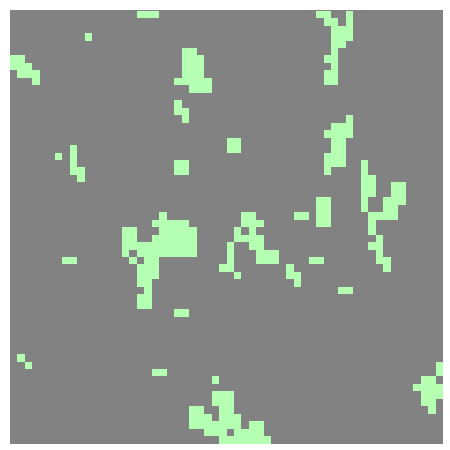
I also wanted to give a bonus to locations in or near protected wildlife areas. I included National Wildlife Refuges (NWRs) from US Fish & Wildlife Service (USFWS)4, and wildlife areas and ecological reserves from California Department of Fish and Wildlife (CDFW).5 This factor may not be important in practice and should be reevaluated. In the map below, green areas are NWRs and gold areas are CDFW lands.
Suitability Analysis
Suitability was determined by assigning scores to the factors under consideration and then adding the scores together to get a final score.
-
Abundance: Relative abundance of Western Grebes was scored from 0 - 10 in proportion to abundance. Areas with very low or no abundance were excluded.
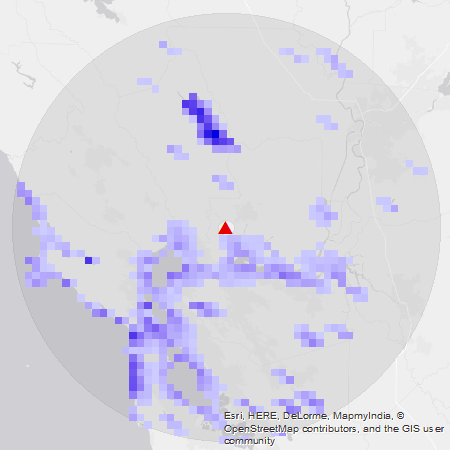
Abundance score for the Western Grebe during its breeding season. Darker shades of blue indicate a higher score.
-
Wildlife Areas: Areas near protected wildlife areas were given 3 points.
-
Drive-time Area: Areas in the 30-minute regions were given 5 points. Areas in the 60-minute regions but outside the 30-minute region were given 2 points.
The scores were added together to create the final score, which I refer to as release value.
Western Grebe release value, breeding season (May 31 - Jul 20). Yellow values are lowest, dark blue are highest.
Results
Here is a closer look at the breeding season release value map in which I have highlighted the highest-scoring areas. Red dots show actual sites where IBR volunteers often release Western Grebes.6
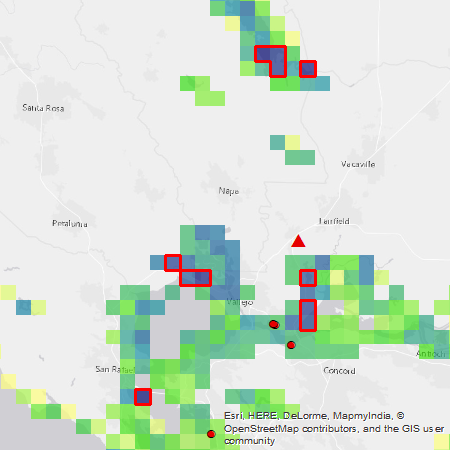
Areas closest to wildlife center: these areas have medium abundance, are nearby, and include parts of the Grizzly Island Wildlife Area. Unfortunately, while some parts of the Grizzly Island Wildlife Area are open to the public, these particular parts do not appear to be actually accessible. Interestingly, IBR regularly releases Western Grebes in Benicia and Martinez, immediately to the southwest of these areas.
Areas west of the wildlife center: these areas have medium abundance, are at the limit of the 30-minute drive area, and include parts of the San Pablo Bay NWR and Napa-Sonoma Marshes Wildlife Area.
Area southwest of the wildlife center: this area has fairly high abundance and is near the Corte Madera Marsh Ecological Reserve.
Areas north of the wildlife center: these areas are at Lake Berryessa which has some of the highest abundance values in the region during the breeding season. There is a CDFW wildlife area nearby (Putah Creek Wildlife Area) but I’m not sure it contains any actual Western Grebe habitat.
Discussion
This analysis can suggest general areas for release, but the selection of a specific site within that area will still require an experienced eye.
-
The areas highlighted above received the highest scores in this analysis, but the score cutoff was arbitrarily selected (greater or equal to 80% of the maximum release value). What score is good enough to consider releasing in that area?
-
One limitation of the analysis is the resolution of the original abundance data. The 3km resolution means that each square covers 9 square km (about 3.5 square miles). Exactly where within that area does it make sense to release?
-
I tried to emphasize accessibility with the drive-time and wildlife areas, but there is no guarantee that a high-scoring area is actually accessible. A human familiar with the area needs to make the decision of whether it makes sense to go there. This issue is exacerbated by the low resolution of the analysis.
-
IBR uses volunteers to release birds when possible. This can factor into the choice of release site because they try to choose a place close to where the volunteer lives, and a particular volunteer might live anywhere within the San Francisco Bay Area.
The upshot of these considerations is that the result of this analysis should be viewed as a suggestion or a point of reference in making the decision of where to release.
Other Resources
- More technical details of the steps in the above analysis.
- PDF map of Western Grebe Release value, using year-round average abundance.
- View the interactive map on ArcGIS Online
Contact
You can contact me at gglouser@gmail.com.
-
eBird Status and Trends: Fink, D., T. Auer, A. Johnston, M. Strimas-Mackey, O. Robinson, S. Ligocki, B. Petersen, C. Wood, I. Davies, B. Sullivan, M. Iliff, S. Kelling. 2020. eBird Status and Trends, Data Version: 2018; Released: Cornell Lab of Ornithology, Ithaca, New York. https://doi.org/10.2173/ebirdst.2018 ↩
-
Drive-time areas generated using openrouteservice. ↩
-
USFWS boundary data (NWRs) from USFWS Geospatial Services ↩
-
CDFW owned and operated lands data from CDFW GIS Clearinghouse ↩
-
A list of actual release sites was provided by Cheryl Reynolds at IBR. ↩